
How Much Does Entertainment Cost Per Month? (2026 Data)

How much does entertainment cost per month? The average American household spends $301 a month, according to the Bureau of Labor Statistics Consumer Expenditure Survey for 2024. The newest release, for 2025, puts the figure at $340 a month, up 13 percent, the largest increase of any major spending category.
The two numbers describe different years, not a disagreement. The 2024 figure is $301 a month, or $3,609 a year, and the 2025 figure is $340 a month, or $4,084 a year. Entertainment spending rose faster than any other household category in 2025, which is why the newer number looks so much higher.
Streaming alone costs the average subscribing household $69 a month across about four paid services, according to Deloitte’s 2026 Digital Media Trends survey. Cable plus streaming together run $185 to $220 a month, the most expensive way to watch television in the United States.
Most people underestimate their own entertainment bill. Consumers guess they spend $86 a month on subscriptions, while their itemised total averages $219 a month, a gap of $133, per C+R Research. That gap is the reason this guide starts with the national average and then helps you compute your own number.
Readers will learn the official average by year, what the Bureau of Labor Statistics counts as entertainment, the full streaming price table for 2026, the cable versus streaming comparison, the budget rules that work, and a savings playbook with dollar amounts. Every figure is labelled with its source and year.
This article is general information only, not financial advice. Averages describe the whole country, not your household. Your number depends on your income, your household size, and what you actually watch, attend, and play.
The Short Answer: $301 to $340 a Month
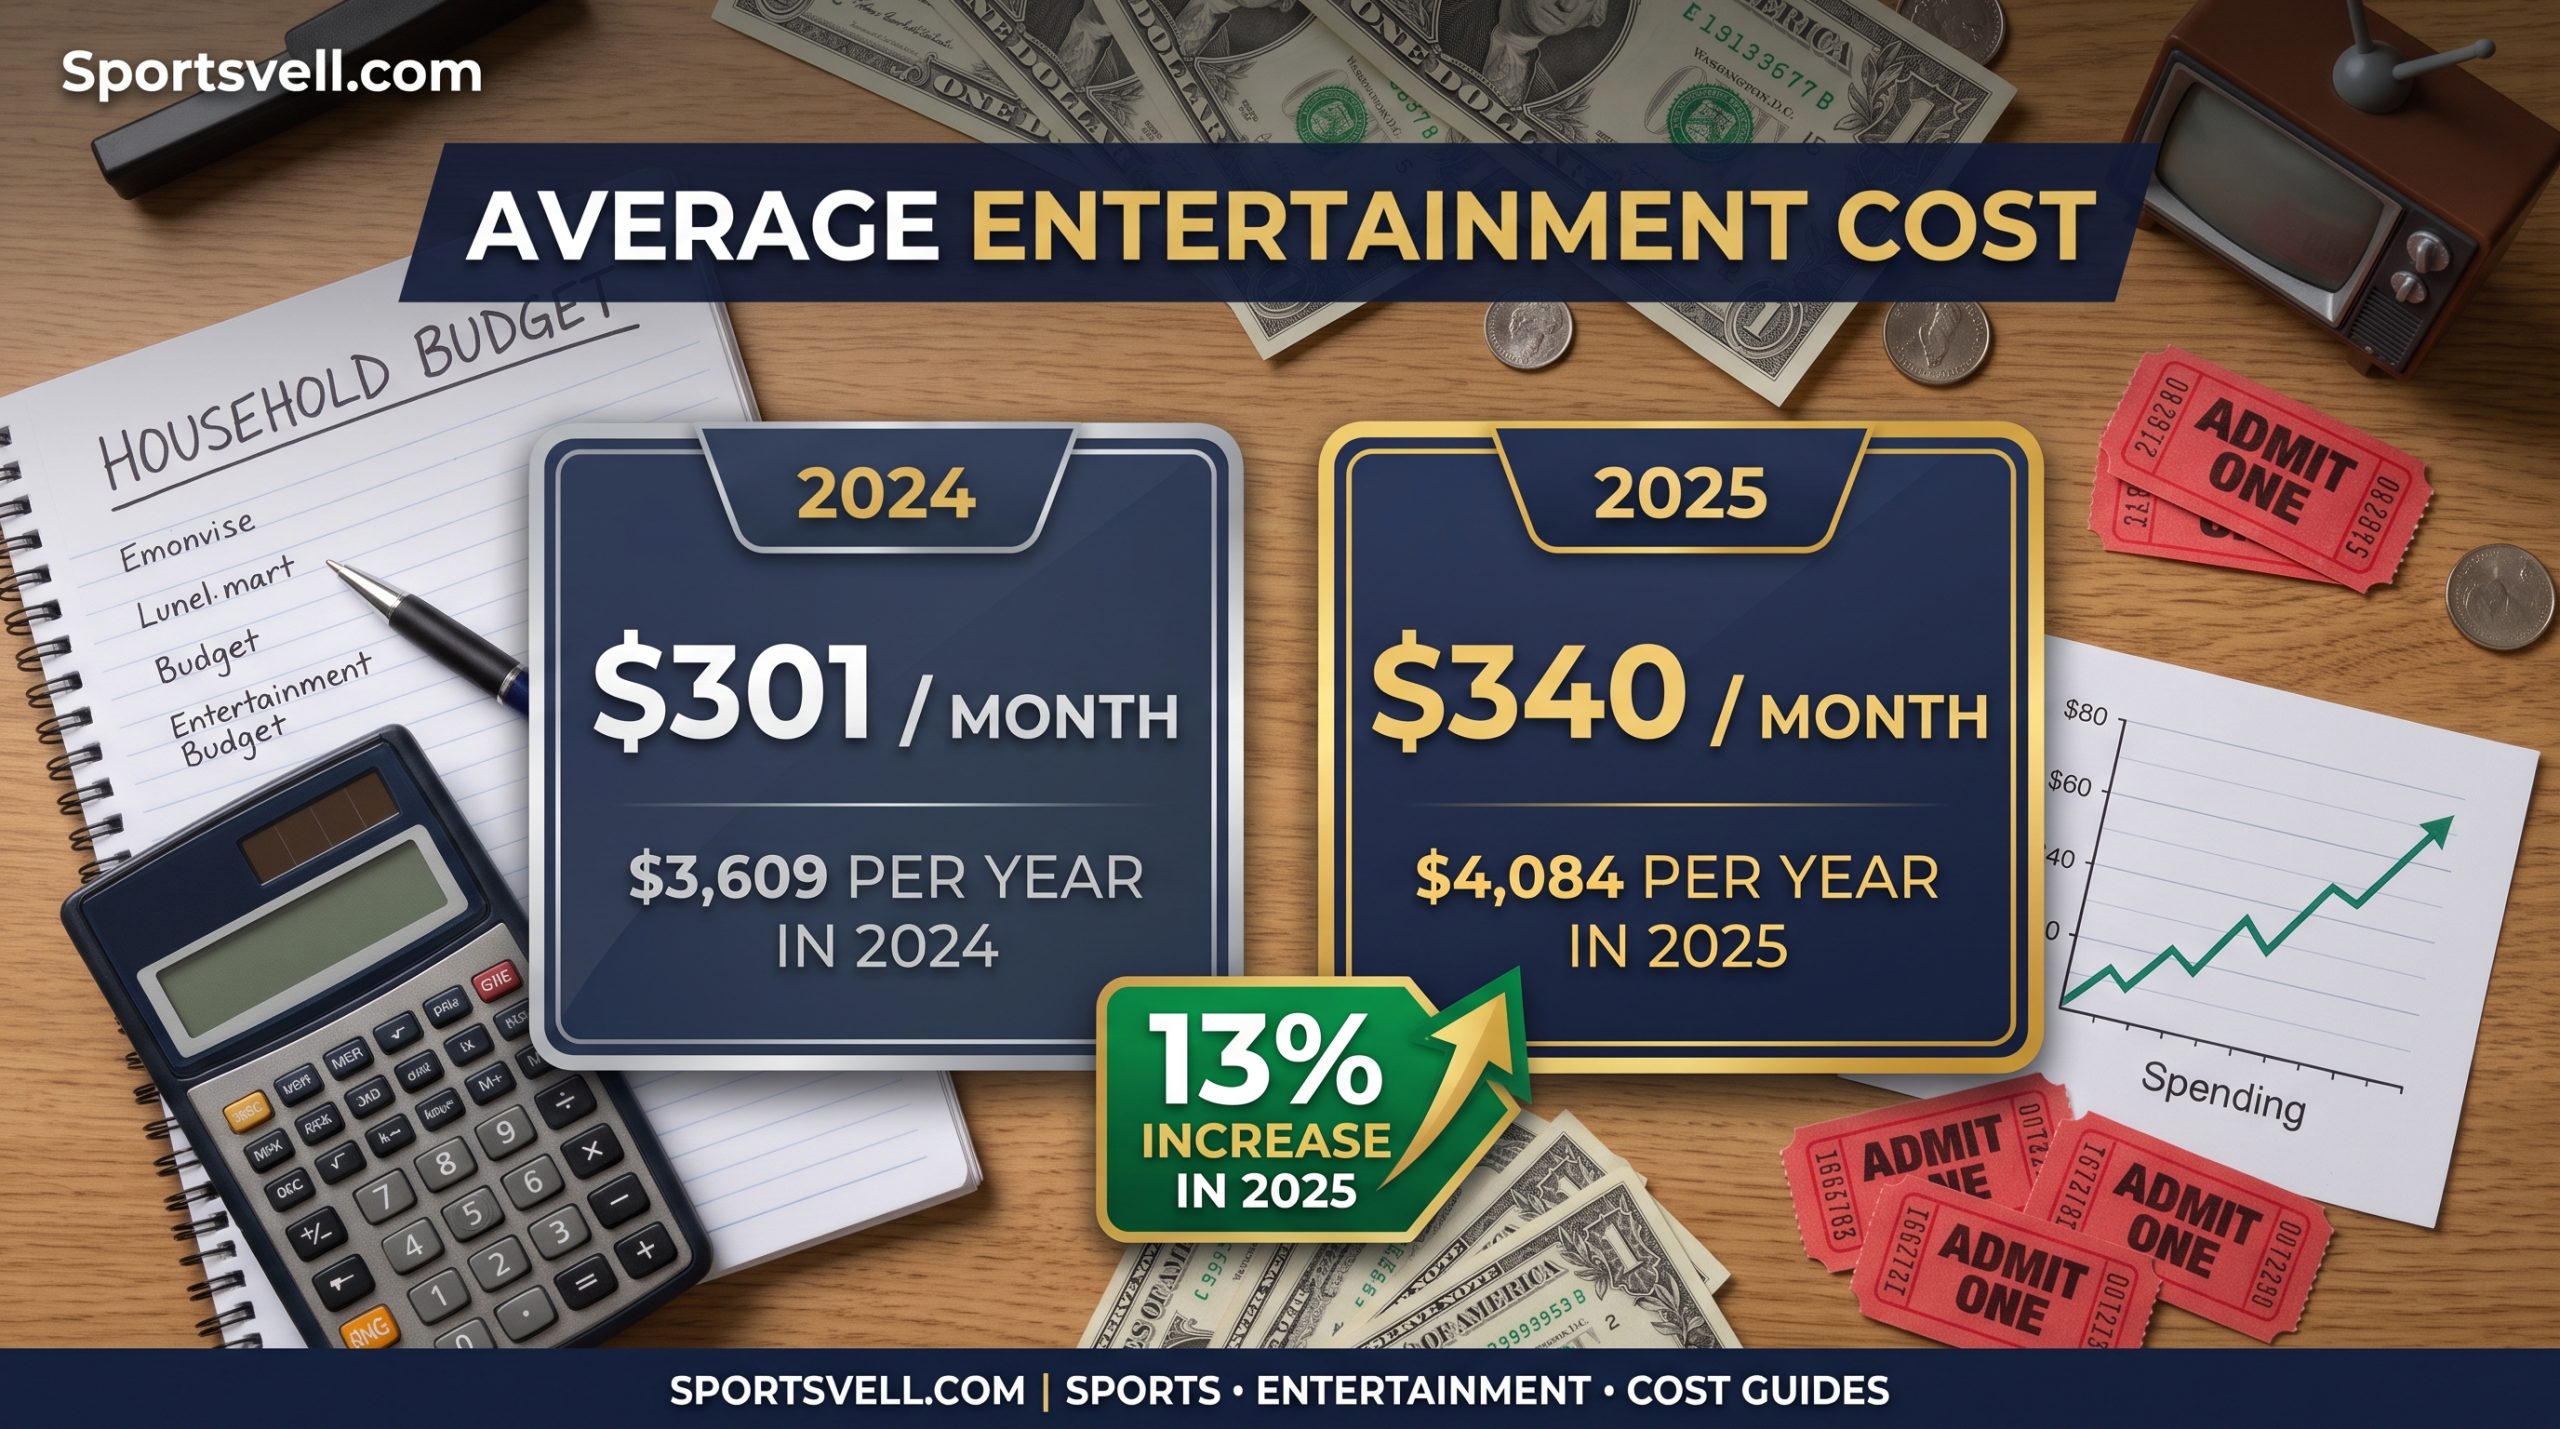
The short answer is $301 a month for 2024 and $340 a month for 2025. Both figures come from the Bureau of Labor Statistics Consumer Expenditure Survey, the most complete public record of how American households spend. The survey reports annual spending, and the monthly figures come from dividing by twelve.
Entertainment was about 4.6 percent of household spending in 2024 and about 5 percent in 2025. The average household spent $6,545 a month in total in 2024 and $6,825 a month in 2025, so entertainment is a small slice of the budget. Housing, transportation, and food take more than 60 percent between them.
| Year | Entertainment per month | Entertainment per year | Share of spending | Change |
|---|---|---|---|---|
| 2022 | About $292 | $3,509 | Not stated | Baseline |
| 2024 | $301 | $3,609 | 4.6% | Down 0.7% from 2023 |
| 2025 | $340 | $4,084 | 5% | Up 13%, largest rise of any category |
The 2024 dip is worth noting. Entertainment was the only major category to shrink in 2024, falling 0.7 percent year over year. The 2025 rebound was the sharpest rise of any category, which suggests households cut back first and then spent again when prices and habits settled.
Most people do not spend $340 every month. The Motley Fool explains the point clearly: entertainment spending is lumpy, with concert tickets, holidays, and new equipment landing in single months. The average spreads those lumps across the year, so your quiet months will look lower and your big months will look higher.
Why Different Pages Give Different Numbers
Different pages quote different years and different methods. ValuePenguin reports $243 a month from an older survey vintage, Zippia reports $375 a month with unclear methods, and Reviews.org reports $278.50 a month for streaming plus connected television only. None of those numbers is wrong on its own terms, but they measure different things.
| Figure | Source | Year | What it measures |
|---|---|---|---|
| $243 a month | ValuePenguin | Older survey vintage | Entertainment, pre-2024 data |
| $292 a month | Bureau of Labor Statistics | 2022 | Entertainment, $3,509 a year |
| $301 a month | Bureau of Labor Statistics | 2024 | Entertainment, $3,609 a year |
| $340 a month | Bureau of Labor Statistics | 2025 | Entertainment, $4,084 a year |
| $375 a month | Zippia | 2026 roundup | Entertainment, methods unclear |
| $278.50 a month | Reviews.org | 2025 | Streaming plus connected TV only |
| $69 a month | Deloitte | 2026 survey | Streaming video only, subscribing households |
The $278.50 figure is the most commonly misread. It covers streaming plus connected television, not all entertainment, so it is not comparable with the $301 Bureau of Labor Statistics figure. The $69 Deloitte figure covers streaming video only, for households that pay for streaming, so it is a slice of the total, not the total itself.
Trust the year-labelled Bureau of Labor Statistics figures first. They come from the official survey, they are the figures the Motley Fool, Ramsey Solutions, and Rocket Money all use, and they are the only ones with a clear method. Use the other figures only for their own slice, with the source and year attached.
What Counts as Entertainment Spending?
The Bureau of Labor Statistics counts four sub-categories as entertainment. Fees and admissions, pets, toys and hobbies, and audio and visual equipment and services make up the total. The category is broader than most people expect, and that breadth explains part of the $301 monthly figure.
Fees and admissions is the largest slice. ValuePenguin breaks the older $243 monthly total into $87 for fees and admissions, $58 for pets, $35 for toys and hobbies, and $14 for audio and visual equipment and services. Those shares come from an older survey vintage, so treat them as proportions, not current prices.
| Sub-category | Monthly amount (older vintage) | What it includes |
|---|---|---|
| Fees and admissions | $87 | Movie tickets, concert tickets, sports tickets, theatre, museum entry |
| Pets | $58 | Pet food, veterinary care, toys, boarding |
| Toys and hobbies | $35 | Games, hobby supplies, toys, collectibles |
| Audio and visual equipment and services | $14 | Streaming services, cable, music, equipment |
The $14 audio and visual figure looks far too low today. It comes from the older ValuePenguin vintage, before streaming prices rose and before most households carried four subscriptions. The Deloitte $69 monthly streaming figure is the current measure for that slice, and it shows how much the category has changed.
What Is Not Counted as Entertainment
Dining out is not counted as entertainment. The Bureau of Labor Statistics puts restaurant meals in the food category, not in entertainment. A dinner before a film is food spending, while the film ticket is entertainment spending. Mixing the two inflates the entertainment number.
Travel is not counted as entertainment either. Holidays and trips sit in the transportation and travel categories. A concert ticket on holiday counts as entertainment, but the flight and hotel do not. The distinction matters when you build your own budget, because travel is usually a separate line.
Alcohol is not entertainment spending. Beer, wine, and spirits have their own category in the survey. A drink at a concert counts as alcohol, not entertainment, even though the two happen together. Keep the categories separate and your budget will be far more accurate.
The Full Breakdown: Where the Money Goes
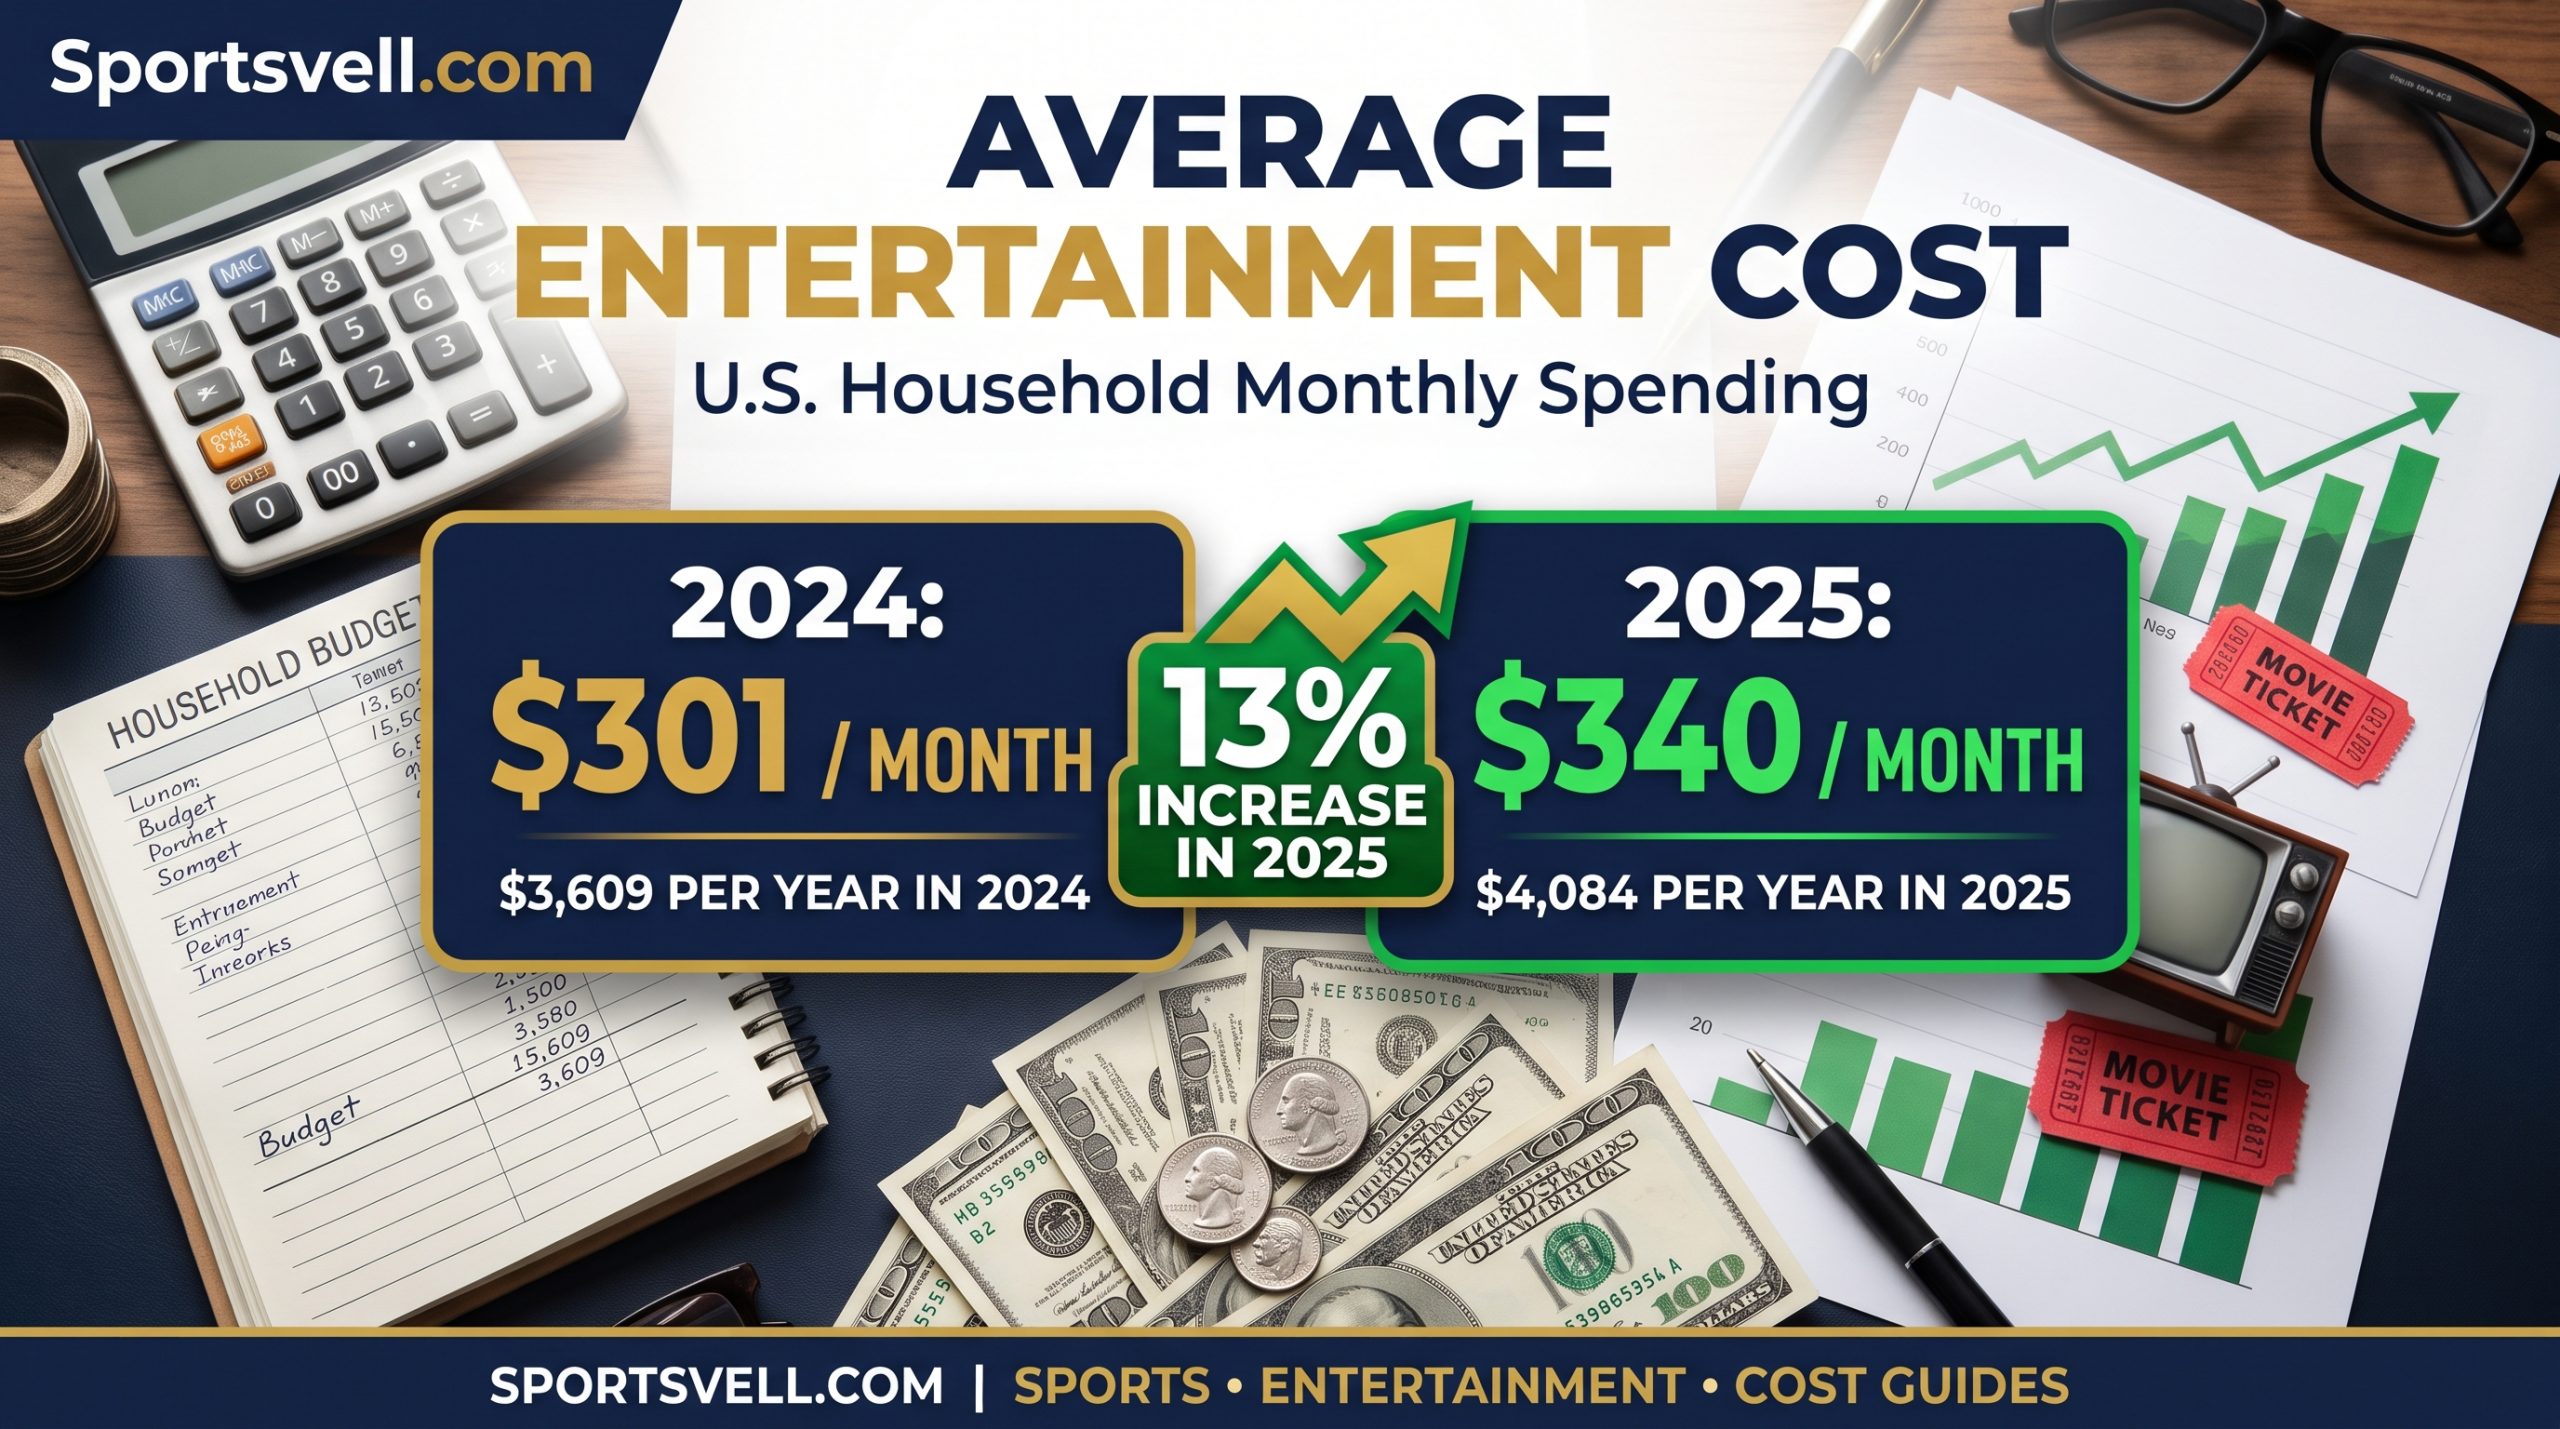
The $301 monthly average splits into four very different kinds of spending. Streaming is the steady monthly bill, cable is the legacy bill that many households still pay, live events are the lumpy big-ticket costs, and hobbies are the long tail. Understanding the split is what lets you cut the total without giving up what you enjoy.
Streaming Subscriptions: $69 a Month
Streaming is the largest steady slice of modern entertainment spending. Deloitte’s 2026 Digital Media Trends survey, of 3,575 United States consumers, found the average subscribing household pays for four streaming services at $69 a month. That figure held flat year over year, even though nearly every major service raised prices.
Nine in ten United States households pay for at least one streaming service. The Deloitte survey puts the figure at 90 percent, and Pew Research Center found that 83 percent of American adults use streaming services. Streaming is no longer a niche habit; it is the default way Americans watch video.
Millennials spend the most on streaming, at $76 a month. Deloitte’s Digital Media Monitor reports that figure for the generation that grew up with on-demand video. Fans of a specific show, franchise, or creator spend $71 a month across four services, while non-fans spend $56 a month across three services.
Streaming prices have risen far faster than general inflation. Forrester found that the average price of ad-free streaming services rose 54 percent from 2021 through 2025, while cumulative United States inflation over the same period was 16 percent. That gap is why the streaming bill feels bigger every year, even when the number of services stays the same.
Cable TV: $115 to $150 a Month With Fees
Cable is still a large bill for the households that keep it. CableCompare reports that cable and satellite cost $90 to $110 a month at the advertised rate, and $115 to $150 once broadcast surcharges, regional sports fees, equipment rental, and taxes are added. The advertised price is never the real price.
Deloitte’s 2025 survey found cable subscribers paying $125 a month on average. That figure sits inside the CableCompare range, and it confirms that the typical cable bill is roughly double the typical streaming bill. The fees are the reason: surcharges and equipment rental add $25 to $40 a month to the advertised rate.
Households that keep cable and add streaming pay the most. CableCompare puts the hybrid total at $185 to $220 a month, the most expensive way to watch television in the United States. The hybrid household pays the full cable bill plus the $69 streaming average, and it gets the worst of both worlds on price.
Live Events: Movies, Concerts, and Sports
Live events are the lumpy part of the entertainment budget. A single concert ticket, a sports ticket, or a family trip to the cinema can cost more than a month of streaming. The Bureau of Labor Statistics puts fees and admissions at $87 a month in the older ValuePenguin breakdown, and that slice covers movies, concerts, sports, theatre, and museum entry.
Sports tickets are the most variable live-event cost. A regular-season game costs far less than a playoff game or a championship, and the seat location matters more than the sport. Our Green Bay Packers vs Dallas Cowboys player stats page covers a marquee regular-season matchup, the kind of game where ticket prices climb well above the season average.
A football game is a full evening of entertainment, not just a ticket. Travel, parking, food, and drinks sit in other budget categories, but they are part of the real cost of the night out. Our guide on how long a football game lasts shows how much time that entertainment fills, which is the other half of the value question.
Prime-time football is the biggest regular live entertainment in American television. Monday Night Football draws millions of viewers every week, and our who won Monday Night Football hub tracks each game. Watching at home costs the streaming bill; watching in person costs the ticket, the travel, and the night out.
Hobbies, Games, and Pets
Hobbies are the quietest part of the entertainment budget. The Bureau of Labor Statistics puts toys and hobbies at $35 a month in the older breakdown, and that slice covers games, hobby supplies, toys, and collectibles. The figure is small per month, but it adds up to $420 a year.
Pets are the surprise inside the entertainment category. The Bureau of Labor Statistics counts $58 a month for pets in the older breakdown, covering food, veterinary care, toys, and boarding. Pet owners rarely think of pet food as entertainment, but the survey puts it there, and it is the second-largest slice of the total.
Cricket is a hobby and a pastime for millions of fans. Following a five-day Test match or a three-hour T20 game costs nothing but time when you watch at home, and the scorecard is the second screen. Our India vs New Zealand match scorecard and our England vs India match scorecard both cover cricket as free-to-follow entertainment, with the scores and stories that make each game worth watching.
Streaming Prices in 2026: Every Major Service
Streaming prices moved repeatedly in 2026. Netflix raised all three tiers on March 26, 2026, its second increase in fourteen months. Apple TV and Peacock raised their rates in August 2026, the fourth increase for each service in four years. Every price in the tables below is labelled with its source and date, and readers should check the provider’s own site before subscribing.
The table below uses The Digital Weekly’s compilation of official pricing for 2026. It is the most complete price chart found in this research, and it was verified live on November 6, 2026. Where a newer figure conflicts with it, the conflict is noted underneath the table.
| Service | Lowest monthly price | Highest standard monthly price | Annual option |
|---|---|---|---|
| Netflix | $7.99 (Standard with ads) | $24.99 (Premium) | No standard annual plan |
| Disney+ | $11.99 (with ads) | $18.99 (Premium) | $189.99 a year for Premium |
| Hulu | $9.99 (with ads) | $18.99 (No Ads) | No standard annual plan |
| Max | $9.99 (Basic with Ads) | $20.99 (Ultimate Ad-Free) | Annual plans on some tiers |
| Paramount+ | $7.99 (Essential) | $12.99 (Premium) | Annual plans available |
| Peacock | $7.99 (Select) | $16.99 (Premium Plus) | $79.99 to $169.99 a year |
| Apple TV+ | $9.99 (single plan) | $9.99 | $99.99 a year |
| Prime Video | $8.99 (standalone) | $14.99 | Included with Prime membership |
Two conflicts need flagging, not hiding. WhereMyMoney, reporting prices as of September 30, 2026, lists Netflix Standard without ads at $19.99, above the $17.99 middle tier in the table above, and lists ad-free Disney+ and Hulu at $21.49 each, above the $18.99 in the table. Netflix raised prices in March 2026, and the newer figures likely reflect that increase. Check the provider’s site for the current price.
Budget Seniors reports Apple TV+ at $12.99 a month, above the $9.99 in the table, which likely reflects the August 2026 increase. The same source reports the cheapest entry point on any major service at $8.99 a month, with Netflix Standard with Ads, Paramount+ Essential, Peacock Select, and standalone Prime Video all at that price.
Live TV Services Price Table
| Service | Monthly price | What it is |
|---|---|---|
| Sling TV Orange | $45.99 | Cheapest live TV service; ESPN and Disney channels |
| Sling TV Blue | $45.99 | FOX, NBC, news channels, 40+ channels |
| Sling Orange + Blue | $60.99 | Both packages combined |
| Philo | $28 to $33 | Essential and Bundle+ plans; no sports |
| YouTube TV Base | $82.99 | About 138 channels, locals, sports, news |
| YouTube TV Entertainment plan | $54.99 | Genre plan; locals plus Bravo, Comedy Central, Food Network, HGTV |
| YouTube TV Sports + News plan | $71.99 | Genre plan for sports and news viewers |
| Hulu + Live TV | $82.99 to $95.99 | Includes Disney+ and ESPN+ in the base package |
| Fubo | $82.99 entry | Built for sports; most sports channels of any live TV service |
YouTube TV added genre plans in February 2026. The Entertainment plan at $54.99 costs $336 a year less than the $82.99 Base Plan, and the Sports + News plan at $71.99 sits between them. A viewer who mainly watches one kind of television can save $11 to $28 a month with a genre plan, because the smaller plans carry fewer channels.
Sling TV is the cheapest live TV service in the table. Orange and Blue each cost $45.99, and both together cost $60.99, which is $22 less than YouTube TV Base. Philo is cheaper still at $28 to $33, but it carries no sports channels, so it suits entertainment-only viewers.
Ad-Supported vs Ad-Free: What You Save
Ad-supported plans are the main price lever in streaming. Deloitte’s 2026 survey found that 68 percent of streaming subscribers now pay for at least one ad-supported plan, up from 46 percent in 2024. That 22-point jump in two years shows how many households are trading a few minutes of commercials for real savings.
| Service | With ads | Ad-free | Monthly saving | Annual saving |
|---|---|---|---|---|
| Netflix | $7.99 | $17.99 to $19.99 | $10 to $12 | $120 to $144 |
| Disney+ | $11.99 | $18.99 to $21.49 | $7 to $9.50 | $84 to $114 |
| Hulu | $9.99 | $18.99 to $21.49 | $9 to $11.50 | $108 to $138 |
| Max | $9.99 | $16.99 to $20.99 | $7 to $11 | $84 to $132 |
| Peacock | $7.99 | $10.99 to $16.99 | $3 to $9 | $36 to $108 |
| Paramount+ | $7.99 | $12.99 | $5 | $60 |
Switching every service to its ad-supported tier saves roughly $50 a month for a household with six subscriptions. Budget Seniors reports that all eight major services on ad-supported plans total roughly $85 to $90 a month, while the same eight ad-free reach $135 to $145 a month. The gap is $50 to $55 a month, or $600 to $660 a year.
Ad-supported plans usually block offline downloads. That matters for travellers and commuters, but it does not matter for home viewing over a steady internet connection. The trade is three to five minutes of commercials per hour of content, and for most households the saving is worth it.
Cable vs Streaming vs Hybrid: Which Costs Most?
The hybrid household pays the most, and it is not close. Cable plus streaming runs $185 to $220 a month, while streaming alone runs $30 to $95 a month. The hybrid household pays the full cable bill, with its fees, plus the full streaming average, and it is the most common setup among pay television households.
| Setup | Monthly cost | What you get | Who it suits |
|---|---|---|---|
| Streaming only | $30 to $95 | On-demand services, no installation, no contract | Lowest cost, if the stack is actively managed |
| Streaming + live TV service | $105 to $150 | Live TV plus on-demand; the functional cable replacement | Households that want live channels without cable |
| Cable only | $115 to $150 | Advertised $90 to $110, plus $25 to $40 in fees | Households that never cut the cord |
| Hybrid (cable + streaming) | $185 to $220 | Full cable plus full streaming | Most expensive; the setup to escape first |
Streaming only is the cheapest setup by a wide margin. A household with two or three on-demand services pays $30 to $50 a month, and even a four-service stack at the Deloitte $69 average is far below cable. The catch is management: several bills, no installation, and no contract mean the household must track and rotate the services itself.
Streaming plus a live TV service is the functional cable replacement. YouTube TV at $82.99 plus $20 to $60 of on-demand services totals $105 to $150 a month. That matches cable with fees, but it has one fewer billing relationship, no equipment rental, and no contract. Sling Orange plus Blue at $60.99 brings the same setup down further.
The stadium is the original live entertainment, and its cost is measured in acres as well as dollars. A football field covers 1.32 acres including both end zones, and the stadium around it holds tens of thousands of fans. Our guide on how many acres a football field covers measures the stage where live sports entertainment happens every week.
How Much Should You Spend on Entertainment?
The Bureau of Labor Statistics average is not a target. It describes the whole country, including high earners and households with lumpy spending, and it is not a recommendation for your household. The right number comes from your income, your household size, and your priorities, and the rules below give you three ways to find it.
The 50/30/20 Rule
The 50/30/20 rule divides take-home pay into three buckets. Fifty percent goes to needs, thirty percent goes to wants, and twenty percent goes to savings and debt repayment. Entertainment sits in the wants bucket, alongside dining out, shopping, travel, and hobbies.
The rule comes from Elizabeth Warren and Amelia Warren Tyagi’s book All Your Worth. The Consumer Financial Protection Bureau uses the same split in its budget worksheet, and North Dakota State University Extension publishes the same 50/30/20 budget sheet. Britannica Money gives a worked example: Ben takes home $5,000 a month, spends $175 on cable and streaming, $250 on movies and sporting events, $400 on shopping, and $675 on eating out, for $1,500 of wants in total.
Entertainment is a slice of the 30 percent, not the whole of it. On $4,000 of take-home pay, the wants bucket is $1,200, and TryBeem’s sample budget splits it into $400 for dining and socialising, $200 for subscriptions and technology, and $600 for recreation and gaming. Your entertainment share will be smaller than $1,200, because dining, shopping, and travel share the same bucket.
The rule is a guideline, not a law. Britannica Money says so directly, and Experian agrees: the proportions can be customised, and households with high fixed costs or heavy debt should shrink the wants bucket. The rule works because it leaves room for fun, which makes a budget easier to keep than a strict one.
The 5-10% of Net Income Guideline
Many financial experts suggest 5 to 10 percent of net income for entertainment. That band is narrower than the 50/30/20 wants bucket, and it is the most practical target for most households. Five percent is the cautious end, and ten percent is the comfortable end.
| Monthly take-home pay | 5% entertainment | 7.5% entertainment | 10% entertainment |
|---|---|---|---|
| $2,000 | $100 | $150 | $200 |
| $3,000 | $150 | $225 | $300 |
| $4,000 | $200 | $300 | $400 |
| $5,000 | $250 | $375 | $500 |
| $6,000 | $300 | $450 | $600 |
| $8,000 | $400 | $600 | $800 |
The Bureau of Labor Statistics average fits the middle of this table. A household taking home $4,000 a month at 7.5 percent spends $300 on entertainment, almost exactly the $301 Bureau of Labor Statistics average for 2024. The average is not a coincidence; it is what the middle of the income distribution actually spends.
Low-income households will sit below the band, and that is normal. When rent and groceries take more than 50 percent of take-home pay, the wants bucket shrinks, and entertainment is the first thing to cut. High-income households can sit above the band without harm, because their needs take a smaller share.
The 60% Solution
The 60% Solution is a stricter framework from former Money magazine editor Richard Jenkins. It caps committed expenses at 60 percent of gross income, and it puts fun spending at 10 percent of gross income. Ten percent of gross income works out to roughly 12 to 15 percent of take-home pay, which is more generous than the 5 to 10 percent band above.
The 60% Solution suits households that want a hard ceiling. The 50/30/20 rule is a target, and the 60% Solution is a cap. Households in a debt-repayment or savings-growth phase should tighten fun spending to 10 to 15 percent of the discretionary pool, while households with a strong financial foundation can sustain 25 to 35 percent on discretionary items.
Budget by Household Size
Household size changes the number more than income does. A single person needs one streaming stack and one ticket, while a family of four needs the same stack plus four tickets, four meals, and larger hobby spending. The figures below are planning estimates built from the Bureau of Labor Statistics average and the streaming data, not official statistics, and they are labelled as estimates.
| Household | Streaming | Live events | Hobbies and other | Estimated monthly total |
|---|---|---|---|---|
| Single person | $30 to $50 | $40 to $80 | $20 to $40 | $90 to $170 |
| Couple | $50 to $70 | $80 to $150 | $40 to $70 | $170 to $290 |
| Family of 3 | $60 to $80 | $120 to $220 | $60 to $100 | $240 to $400 |
| Family of 4 | $69 to $90 | $150 to $280 | $80 to $130 | $300 to $500 |
The family-of-four range matches the Diplomariot’s $250 to $500 range for average monthly entertainment costs, and it brackets the $301 Bureau of Labor Statistics average. A family of four at the low end spends about the national average, and a family of four at the high end spends about 65 percent more. Location matters too: a family in a major city spends significantly more than a family in a small town.
Cricket is the cheapest live entertainment a family can follow. A Test match runs for five days and a T20 game for three hours, and following the scorecard at home costs nothing beyond the streaming bill. Our India vs South Africa match scorecard hub is built for that habit, with the latest match at the top and the full history below it.
Entertainment Costs by Generation
Age changes what entertainment costs and how it is bought. Deloitte’s research shows clear generation gaps in streaming spending, and those gaps explain why the national average hides very different household realities. The generation split is the segmentation no entertainment-cost page uses, and it belongs in this guide.
Millennials Spend the Most on Streaming
Millennials spend $76 a month on streaming, the most of any generation. Deloitte’s Digital Media Monitor reports that figure, $7 above the $69 average for all subscribing households. Millennials were the first generation to cut cable at scale, and they replaced it with the largest streaming stacks.
Millennials also keep the most services. They average four or more paid services, and they are the most likely to pay for premium and ad-free tiers. The $76 figure reflects both the number of services and the tier choices, not just one expensive subscription.
Gen Z and User-Generated Content
Gen Z spends less on paid streaming and more time on free content. Deloitte’s research found that Gen Z consumers spend 1.5 hours per day watching user-generated content on platforms such as YouTube, substantially more than older generations. Free video is entertainment too, and it costs nothing beyond the internet bill.
The free-content habit is a budget lesson for every generation. Tubi, Pluto TV, and Kanopy through a public library cover far more than most people realise, and they cost nothing. A household that adds one free service and drops one paid service saves $8 to $12 a month without losing anything it watches regularly.
Why You Probably Spend More Than You Think
The most important number in this guide is not the average. It is the gap between what people think they spend on subscriptions and what they actually spend. That gap is $133 a month, and it is the reason so many households feel their entertainment budget is out of control.
The $86 vs $219 Underestimation Gap
Consumers estimate their monthly subscription bill at $86, while their itemised total averages $219. C+R Research found that gap in a survey of 1,000 United States consumers, and the study remains the latest edition of that research. The gap is more than two and a half times the estimate, and it is the largest blind spot in household budgeting.
About 89 percent of consumers underestimate their monthly subscription total. West Monroe’s survey found that figure, and two-thirds of consumers are off by more than $200. The pattern is consistent: small recurring charges are invisible, and they add up to a second rent payment over the year.
The $219 total covers all subscriptions, not just entertainment. It includes streaming, music, apps, cloud storage, and every other recurring charge. Streaming alone is $69 of it, and the rest is the long tail of small charges that no one remembers signing up for. The entertainment slice is the largest single piece, and it is the easiest to audit.
Subscription Fatigue and Forgotten Charges
Subscription fatigue is the feeling that there are too many bills to track. The average household maintains about 5.2 active streaming subscriptions, according to Bango’s Subscription Signals 2026 report, and Deloitte puts the paid-service count at four. Either way, the household is paying for services it watches rarely or not at all.
Forgotten subscriptions are the leak. A free trial that converts to a paid plan, a service kept for one show that ended, and a duplicate subscription through a bundle all look like $8 to $15 charges that no one notices. Three forgotten subscriptions cost $25 to $45 a month, or $300 to $540 a year.
Price hikes make the leak worse. Deloitte found that 73 percent of consumers are frustrated that the services they subscribe to keep raising prices, and 41 percent believe the content available on the services they pay for is not worth the price. Frustration without action is the most expensive habit in this guide.
How to Cut Your Entertainment Costs
Cutting entertainment costs does not mean giving up entertainment. It means paying for what you watch, dropping what you do not, and using the free and cheap options that already exist. The five tactics below are ranked by saving size, and together they can cut $50 to $100 a month from a typical household bill.
| Tactic | Monthly saving | Annual saving | Effort |
|---|---|---|---|
| Audit every subscription | $25 to $45 | $300 to $540 | One hour, once |
| Rotate services | $40 to $60 | $600 to $900 | Monthly, five minutes |
| Switch to ad-supported tiers | $40 to $55 | $480 to $660 | Once per service |
| Use annual billing | $8 to $15 | $100 to $180 | Once a year |
| Use free services | $8 to $25 | $100 to $300 | Once, then free |
| Drop cable for streaming + live TV | $30 to $60 | $360 to $720 | One afternoon |
Audit Every Subscription
List every recurring charge on your bank and credit card statements. Go back three months, because annual charges and quarterly charges hide in a single month. Write down each service, its price, and the last time anyone in the household used it. Cancel anything unused for 30 days or more.
Budget Seniors reports that cancelling the services you do not watch regularly saves the average household $600 to $900 a year. The audit is the single highest-value hour in this guide, because it finds the forgotten subscriptions that cost $25 to $45 a month. Repeat the audit every three months, because new trials and bundles keep appearing.
Rotate Services Instead of Keeping Them All
Rotation means keeping one or two services at a time and switching when you finish a show. Watch one service for a month, cancel it, and start the next one. The content does not disappear; it waits for your return, and the saving is the price of every service you are not currently watching.
Rotation saves $40 to $60 a month for a four-service household. Keeping two services instead of four cuts the bill roughly in half, and the $69 Deloitte average falls to about $30. The cost is five minutes a month to cancel and resubscribe, and the benefit is $600 to $900 a year.
Switch to Ad-Supported Tiers
Ad-supported tiers are the cheapest way to keep every service. The saving is $7 to $12 a month per service, and a six-service household saves $40 to $55 a month. Deloitte’s 2026 survey shows 68 percent of subscribers already use at least one ad-supported plan, so the trade is now the norm, not the exception.
The trade is three to five minutes of commercials per hour. Ad-supported plans usually block offline downloads, so travellers should keep one ad-free service for trips. For home viewing, the saving is worth the interruption, and the content is identical.
Use Annual Billing Where It Saves Money
Annual billing usually gives twelve months for the price of ten. Disney+ Premium costs $189.99 a year against $18.99 a month, a saving of about $38 a year. Peacock’s annual plans run $79.99, $109.99, and $169.99 against monthly rates, and Apple TV+ costs $99.99 a year against $9.99 a month.
Pay annually only for services you keep all year. An annual plan for a service you rotate away from wastes money, not saves it. The rule is simple: annual billing for the one or two services you never cancel, monthly billing for everything else.
Use Free Services: Tubi, Pluto TV, Kanopy
Free streaming covers far more than most people realise. Tubi, Pluto TV, and Kanopy through a public library offer films, series, and documentaries at no cost. Budget Seniors calls them the cheapest entry point of all, because they cost nothing and they cover the hours when you would otherwise pay for a service you barely watch.
Student discounts and bundles are the other cheap lever. Students get reduced rates on several services, and bundles such as the Prime Video five-service bundle at $29.99 a month (AMC+, BritBox, MGM+, PBS Masterpiece, and STARZ, launched September 15, 2026) can cost less than buying the services separately. Comcast internet customers can get Peacock with ads, Netflix with ads, and Apple TV+ together for $18 a month.
FAQs About Entertainment Costs Per Month
How much does entertainment cost per month?
The average American household spends $301 a month on entertainment, according to the Bureau of Labor Statistics Consumer Expenditure Survey for 2024. The newest release, for 2025, puts the figure at $340 a month, up 13 percent. Your own number depends on your income, household size, and habits.
What is the average entertainment cost per month in the US?
The average is $301 a month for 2024 and $340 a month for 2025, per the Bureau of Labor Statistics. The figures are national averages across all households, and they include streaming, cable, live events, hobbies, and pets. Single-person households spend less, and families of four spend more.
How much do Americans spend on entertainment per month?
Americans spend $301 a month on average (2024) and $340 a month (2025), per the Bureau of Labor Statistics. Entertainment is about 4.6 percent of household spending in 2024 and about 5 percent in 2025. The total household budget averages $6,545 a month in 2024 and $6,825 a month in 2025.
Is $300 a month a lot for entertainment?
No, $300 a month is about average for entertainment. It matches the $301 Bureau of Labor Statistics figure for 2024 almost exactly. Whether it is a lot for you depends on your income: $300 is 10 percent of a $3,000 take-home pay and 5 percent of a $6,000 take-home pay.
How much should I spend on entertainment per month?
Most financial experts suggest 5 to 10 percent of net income for entertainment. On $4,000 of take-home pay, that is $200 to $400 a month. The 50/30/20 rule puts entertainment inside the 30 percent wants bucket, which is $1,200 on $4,000 of take-home pay, shared with dining, shopping, and travel.
What percentage of income should go to entertainment?
Five to ten percent of net income is the usual guideline for entertainment. The 50/30/20 rule allows up to 30 percent for all wants combined, and the 60% Solution puts fun spending at 10 percent of gross income. Households repaying debt should stay near 5 percent, and households with a strong financial base can go toward 10 percent.
How much does entertainment cost per month for a family of 4?
A family of four spends an estimated $300 to $500 a month on entertainment. Streaming runs $69 to $90, live events run $150 to $280, and hobbies and other spending run $80 to $130. Those are planning estimates, not official statistics, and location matters: city families spend more than small-town families.
How much does entertainment cost per month for a single person?
A single person spends an estimated $90 to $170 a month on entertainment. Streaming runs $30 to $50, live events run $40 to $80, and hobbies run $20 to $40. Those are planning estimates built from the Bureau of Labor Statistics average and the Deloitte streaming data.
How much does streaming cost per month on average?
Streaming costs $69 a month on average for a subscribing household, according to Deloitte’s 2026 survey. The average household pays for four services. A household that counts all subscriptions, not just streaming, spends $219 a month on average, per C+R Research.
How many streaming services does the average household pay for?
The average household pays for four streaming services, according to Deloitte. Bango’s Subscription Signals 2026 report puts the figure at about 5.2 active subscriptions per household. The difference comes from counting: Deloitte counts paid video services, while Bango counts all active subscriptions.
How much does Netflix cost per month?
Netflix costs $7.99 to $24.99 a month in the United States, according to The Digital Weekly’s compilation of official pricing for 2026. Standard with ads is $7.99, Standard is $17.99, and Premium is $24.99. Newer reports list Standard without ads at $19.99 after the March 2026 price rise, so check Netflix’s own help page for the current price.
How much does Disney+ cost per month?
Disney+ costs $11.99 to $18.99 a month, according to The Digital Weekly’s compilation of official pricing for 2026. The ad-supported plan is $11.99, Premium is $18.99, and Premium costs $189.99 a year. Newer reports list the ad-free plan at $21.49, so check the provider’s site for the current price.
How much does Hulu cost per month?
Hulu costs $9.99 to $18.99 a month for on-demand plans, according to The Digital Weekly’s compilation of official pricing for 2026. Hulu with ads is $9.99, and Hulu without ads is $18.99. Hulu plus Live TV costs $82.99 to $95.99 a month and includes Disney+ and ESPN+.
How much does YouTube TV cost per month?
YouTube TV costs $82.99 a month for the Base Plan, with about 138 channels. Genre plans added in February 2026 cost $54.99 for Entertainment and $71.99 for Sports plus News. Prices were checked on October 31, 2026, and they exclude tax and vary by area.
How much does cable TV cost per month?
Cable TV costs $115 to $150 a month once fees are added, according to CableCompare. The advertised rate is $90 to $110, and broadcast surcharges, regional sports fees, equipment rental, and taxes add $25 to $40. Deloitte’s 2025 survey found cable subscribers paying $125 a month on average.
Is streaming cheaper than cable?
Yes, streaming alone is much cheaper than cable. Streaming only costs $30 to $95 a month, while cable costs $115 to $150 with fees. Streaming plus a live TV service costs $105 to $150, about the same as cable. Cable plus streaming together costs $185 to $220, the most expensive setup.
How much does it cost to subscribe to all streaming services?
Subscribing to the eight major services costs roughly $85 to $90 a month with ads, and $135 to $145 a month ad-free, according to Budget Seniors. Budget Seniors also reports that the same eight services ad-free cost $139 a month combined. Those totals cover Netflix, Disney+, Hulu, Max, Apple TV+, Peacock, Paramount+, and Prime Video.
What is the cheapest streaming service?
The cheapest entry point on any major service is $8.99 a month, according to Budget Seniors. Netflix Standard with Ads, Paramount+ Essential, Peacock Select, and standalone Prime Video all start at that price. Free services such as Tubi, Pluto TV, and Kanopy cost nothing at all.
What is the cheapest live TV streaming service?
Sling TV is the cheapest live TV streaming service, at $45.99 a month for Orange or Blue, and $60.99 for both together. Philo is cheaper at $28 to $33 a month, but it carries no sports channels. YouTube TV Base costs $82.99 a month.
Are ad-supported plans worth it?
Yes, ad-supported plans are worth it for most households. They save $7 to $12 a month per service, or $40 to $55 a month across six services. The trade is three to five minutes of commercials per hour, and most plans block offline downloads. Deloitte found 68 percent of subscribers already use at least one ad-supported plan.
What is included in entertainment spending?
The Bureau of Labor Statistics counts four sub-categories as entertainment: fees and admissions, pets, toys and hobbies, and audio and visual equipment and services. Fees and admissions covers movie tickets, concert tickets, sports tickets, theatre, and museum entry. Dining out, travel, and alcohol sit in other categories.
What is the 50/30/20 rule for entertainment?
The 50/30/20 rule puts entertainment in the 30 percent wants bucket. Fifty percent of take-home pay goes to needs, 30 percent to wants, and 20 percent to savings and debt repayment. On $4,000 of take-home pay, the wants bucket is $1,200, shared between entertainment, dining, shopping, and travel.
How can I reduce my entertainment costs?
Audit every subscription, rotate services, switch to ad-supported tiers, use annual billing, and try free services. The audit alone saves $25 to $45 a month, rotation saves $40 to $60, and ad-supported tiers save $40 to $55. Together the tactics can cut $50 to $100 a month from a typical household bill.
How much do Americans spend on subscriptions vs what they think?
Americans estimate they spend $86 a month on subscriptions, while their actual itemised total averages $219 a month, per C+R Research. The gap is $133 a month, and about 89 percent of consumers underestimate their total. Small recurring charges are invisible until they are added up.
Why do streaming prices keep going up?
Streaming prices rise because content costs rise and services raise rates to cover them. Forrester found ad-free streaming prices rose 54 percent from 2021 through 2025, while general United States inflation was 16 percent. Netflix raised prices in March 2026, and Apple TV and Peacock raised rates in August 2026.
Conclusion
How much does entertainment cost per month? The average American household spends $301 a month in 2024 and $340 a month in 2025, according to the Bureau of Labor Statistics. Streaming adds $69 a month for the average subscribing household, cable adds $115 to $150 with fees, and the hybrid household that keeps both pays $185 to $220 a month.
Your number is not the national average. It comes from your income, your household size, and what you actually watch, attend, and play. Five to ten percent of net income is the sensible band for most households, and the budget tables in this guide turn that band into a dollar figure for your pay.
The cheapest entertainment is the kind you already pay for and do not use. Audit your subscriptions, rotate the services, switch to ad-supported tiers, and try the free options. The average household can cut $50 to $100 a month without giving up anything it watches regularly, and that saving is worth more than any single subscription.
Sport is the entertainment that costs the least per hour. A football game fills an evening, a cricket Test fills five days, and following the scorecard at home costs nothing beyond the streaming bill. Keep exploring the games that entertain you, from Monday Night Football to the latest India vs New Zealand cricket, and keep the budget for the nights that are worth paying for.